

ONE DATA | DATA MAP
Gain transparency & discoverability.Ensure end-to-end data lineage.Layer and cluster your perspective on data.
Explore the landscape. Discover your assets, trace their connections, and turn visibility into action.
One DataData Map
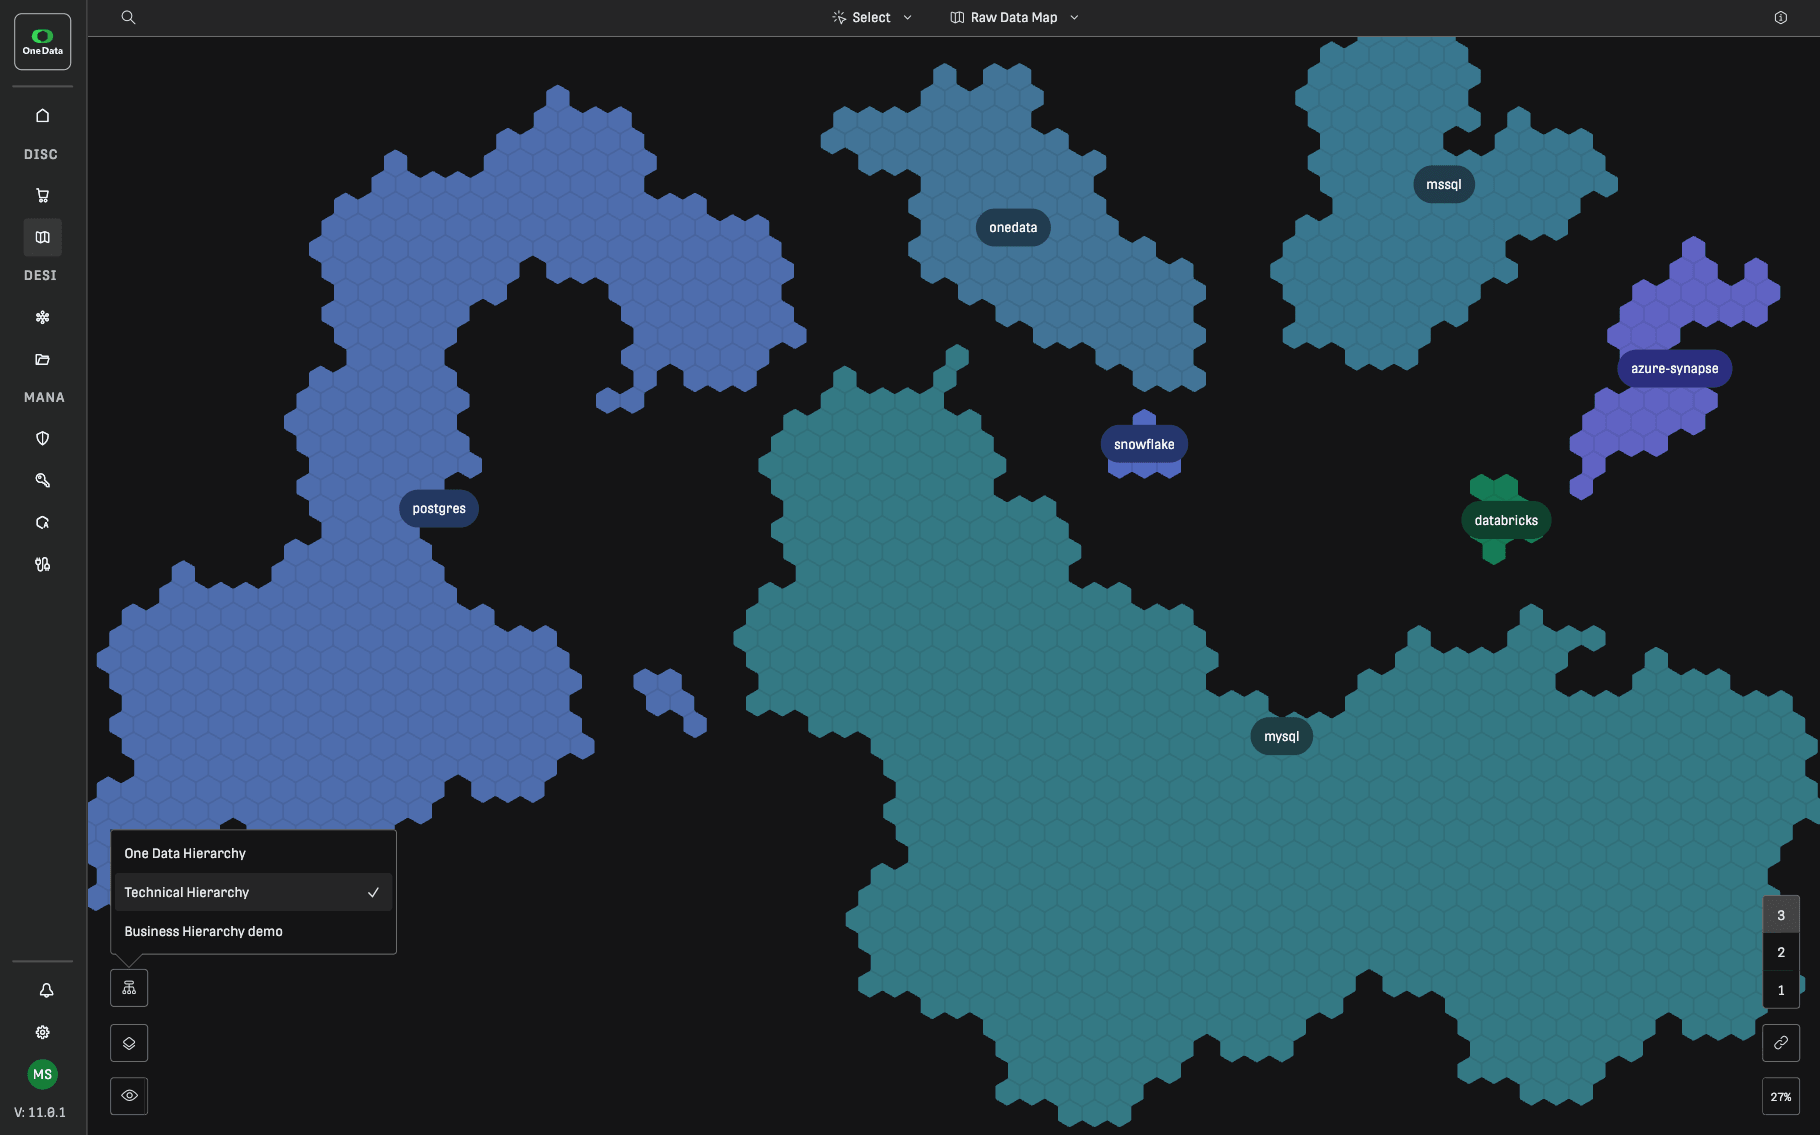
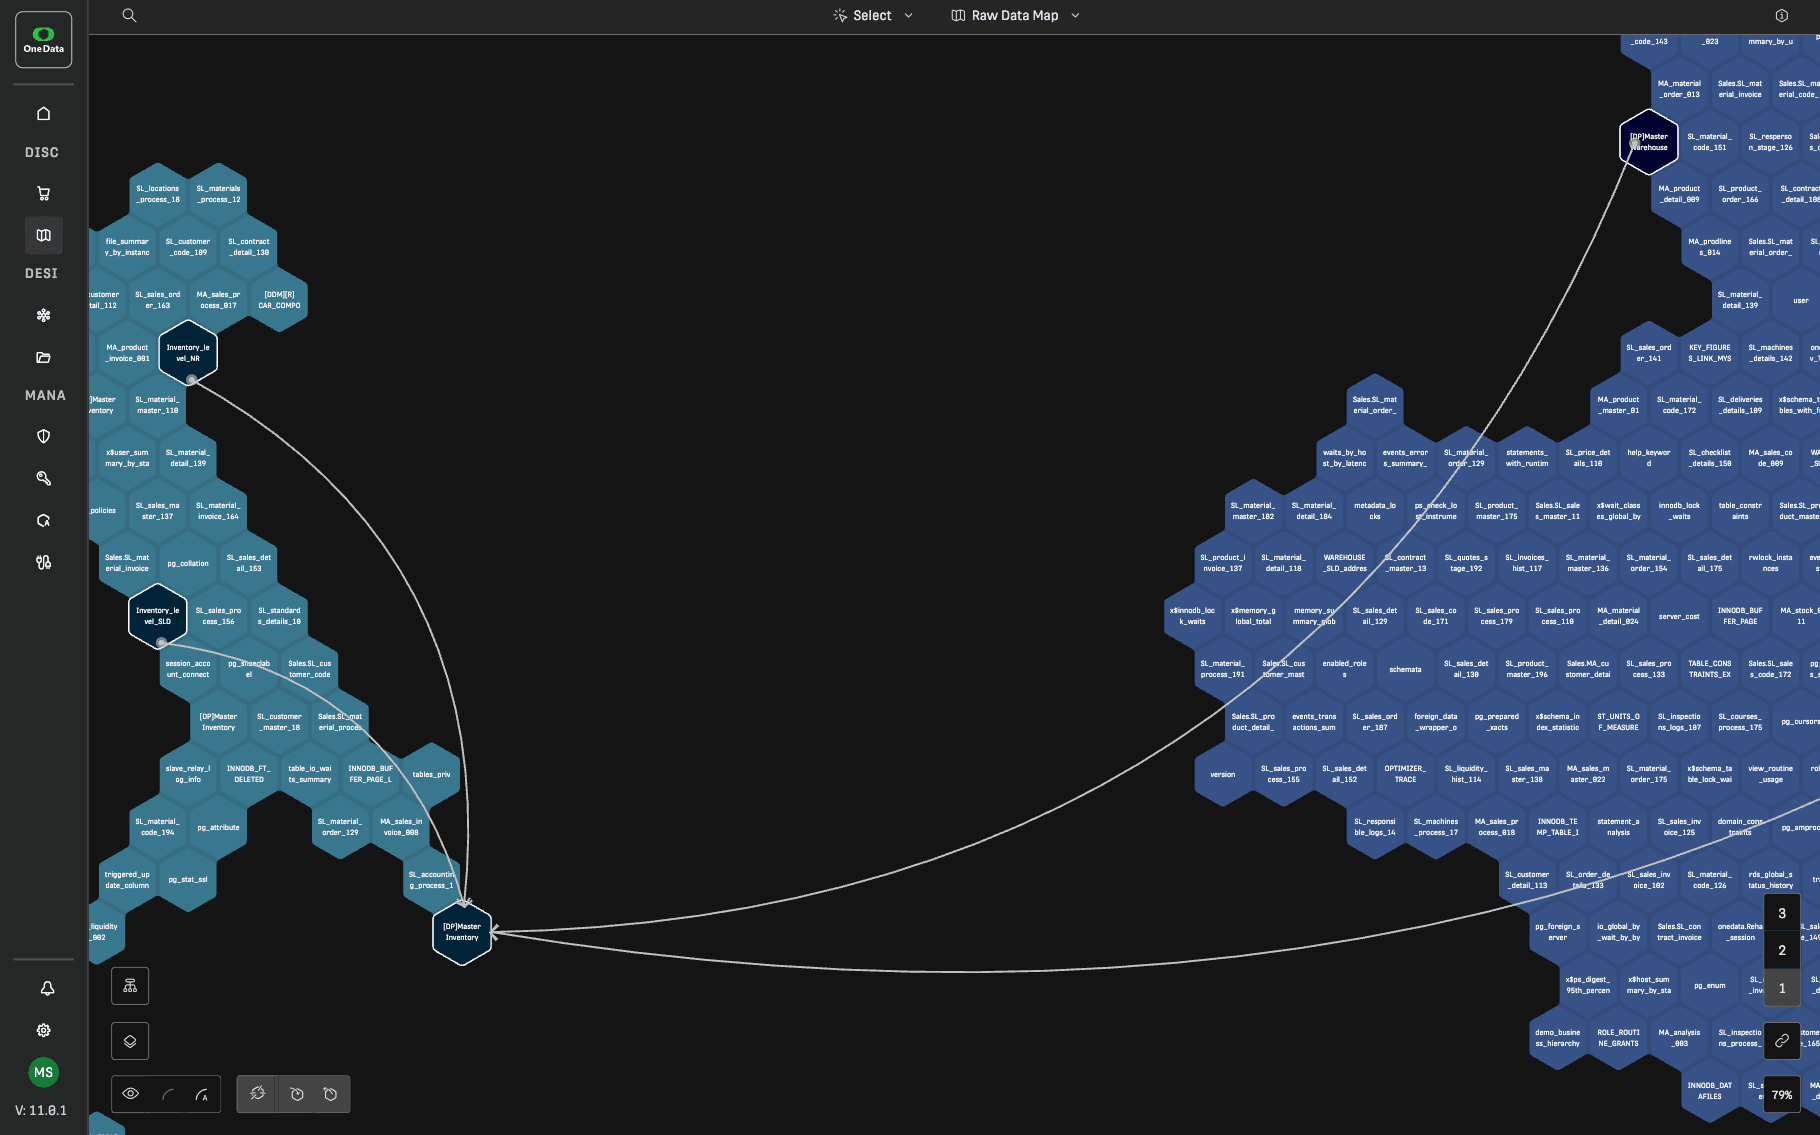
The Data Map gives you an interactive, holistic view of your entire data landscape, with every source, schema, and asset organized so you can explore, discover, and make sense of your metadata at a glance. Trace the data flow between assets to follow data from its origin through every transformation to its final destination. Layer the map with insights on quality, usage, sensitive information, or ownership, and switch between technical and business-oriented hierarchies to match the perspective you need.
The map shows all the metadata of assets in your entire enterprise landscape. Explore an always-current, interactive, map of every source system, schema, report or data product, organized into clusters that reflect your business. Zoom in to inspect individual assets, switch between technical and business hierarchies, and instantly identify what’s in use, or still needs governance.
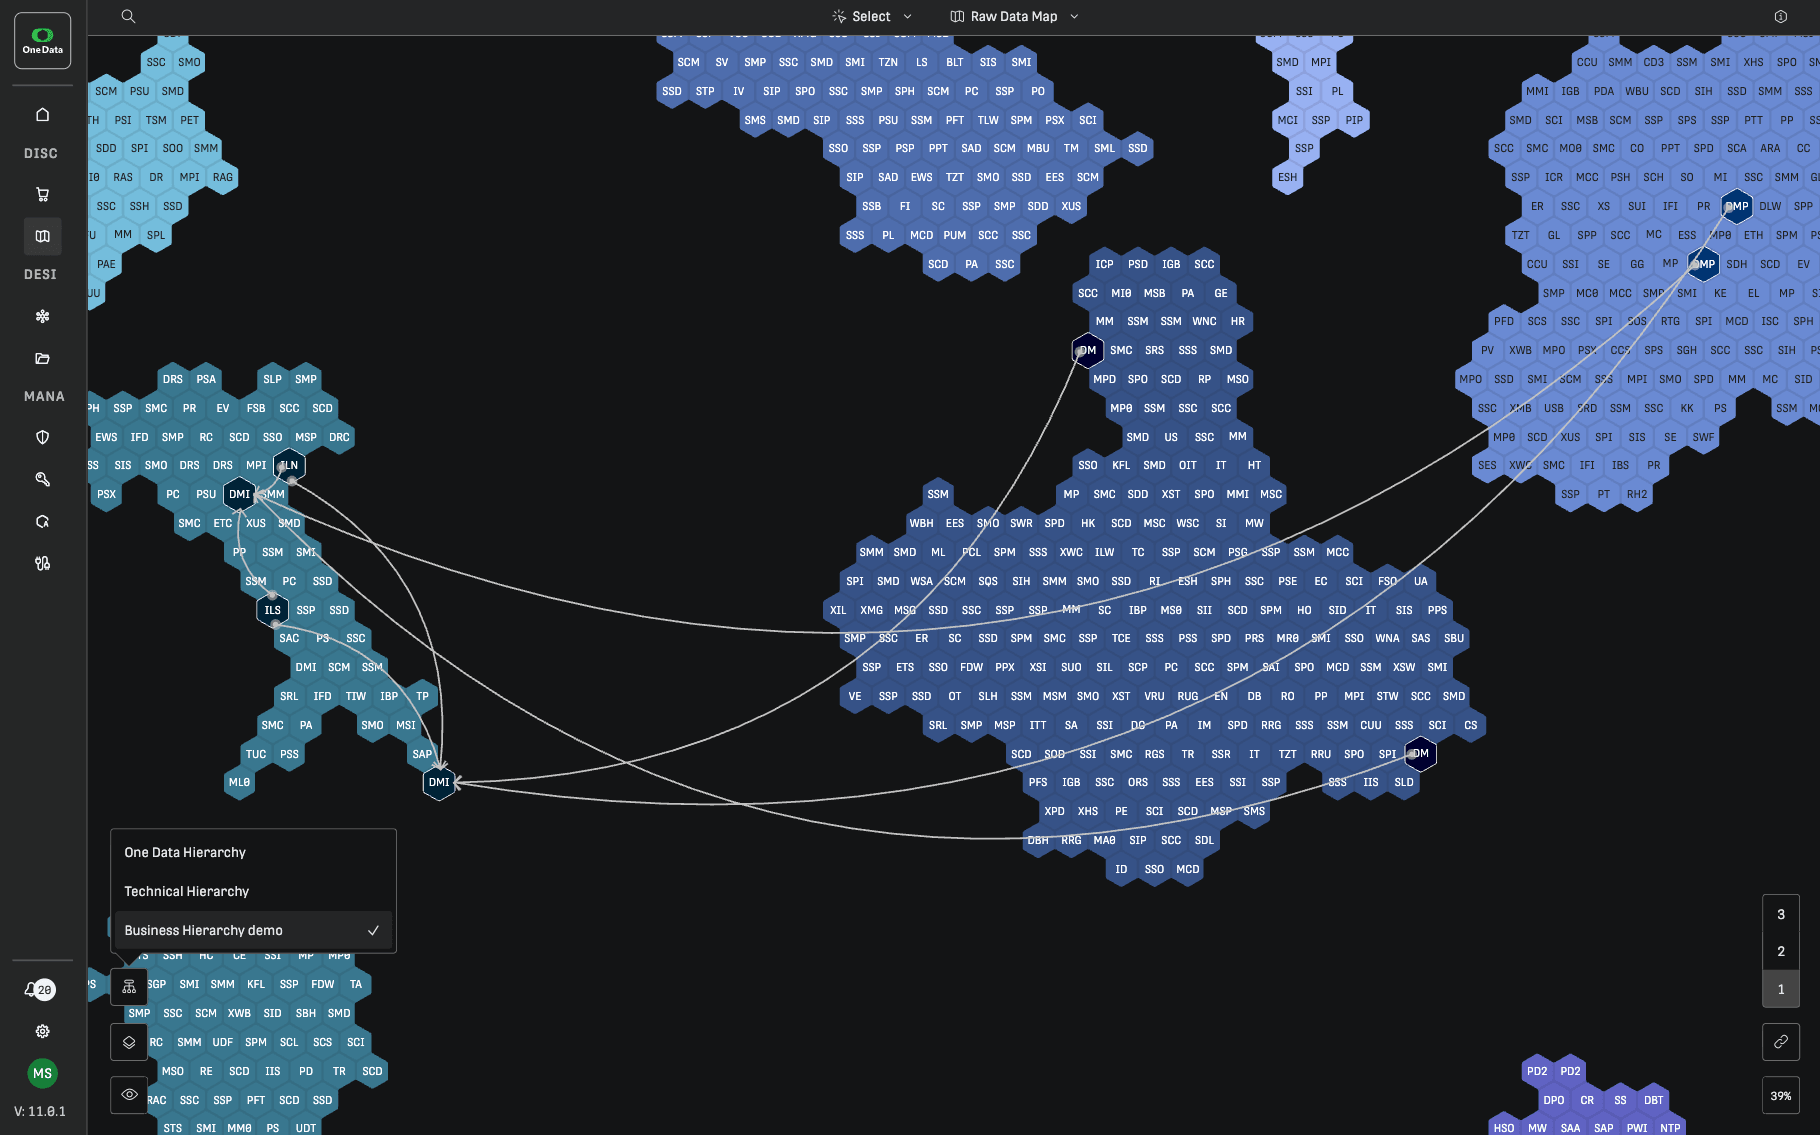
Get lineage across systems, warehouses, and domains. Gain trust in your data and trace any asset from its raw origin through every transformation step to the data product it feeds. Investigate upstream sources to validate a number or follow downstream impacts before making a change. Decisions are grounded in the full picture, not just a slice of it.
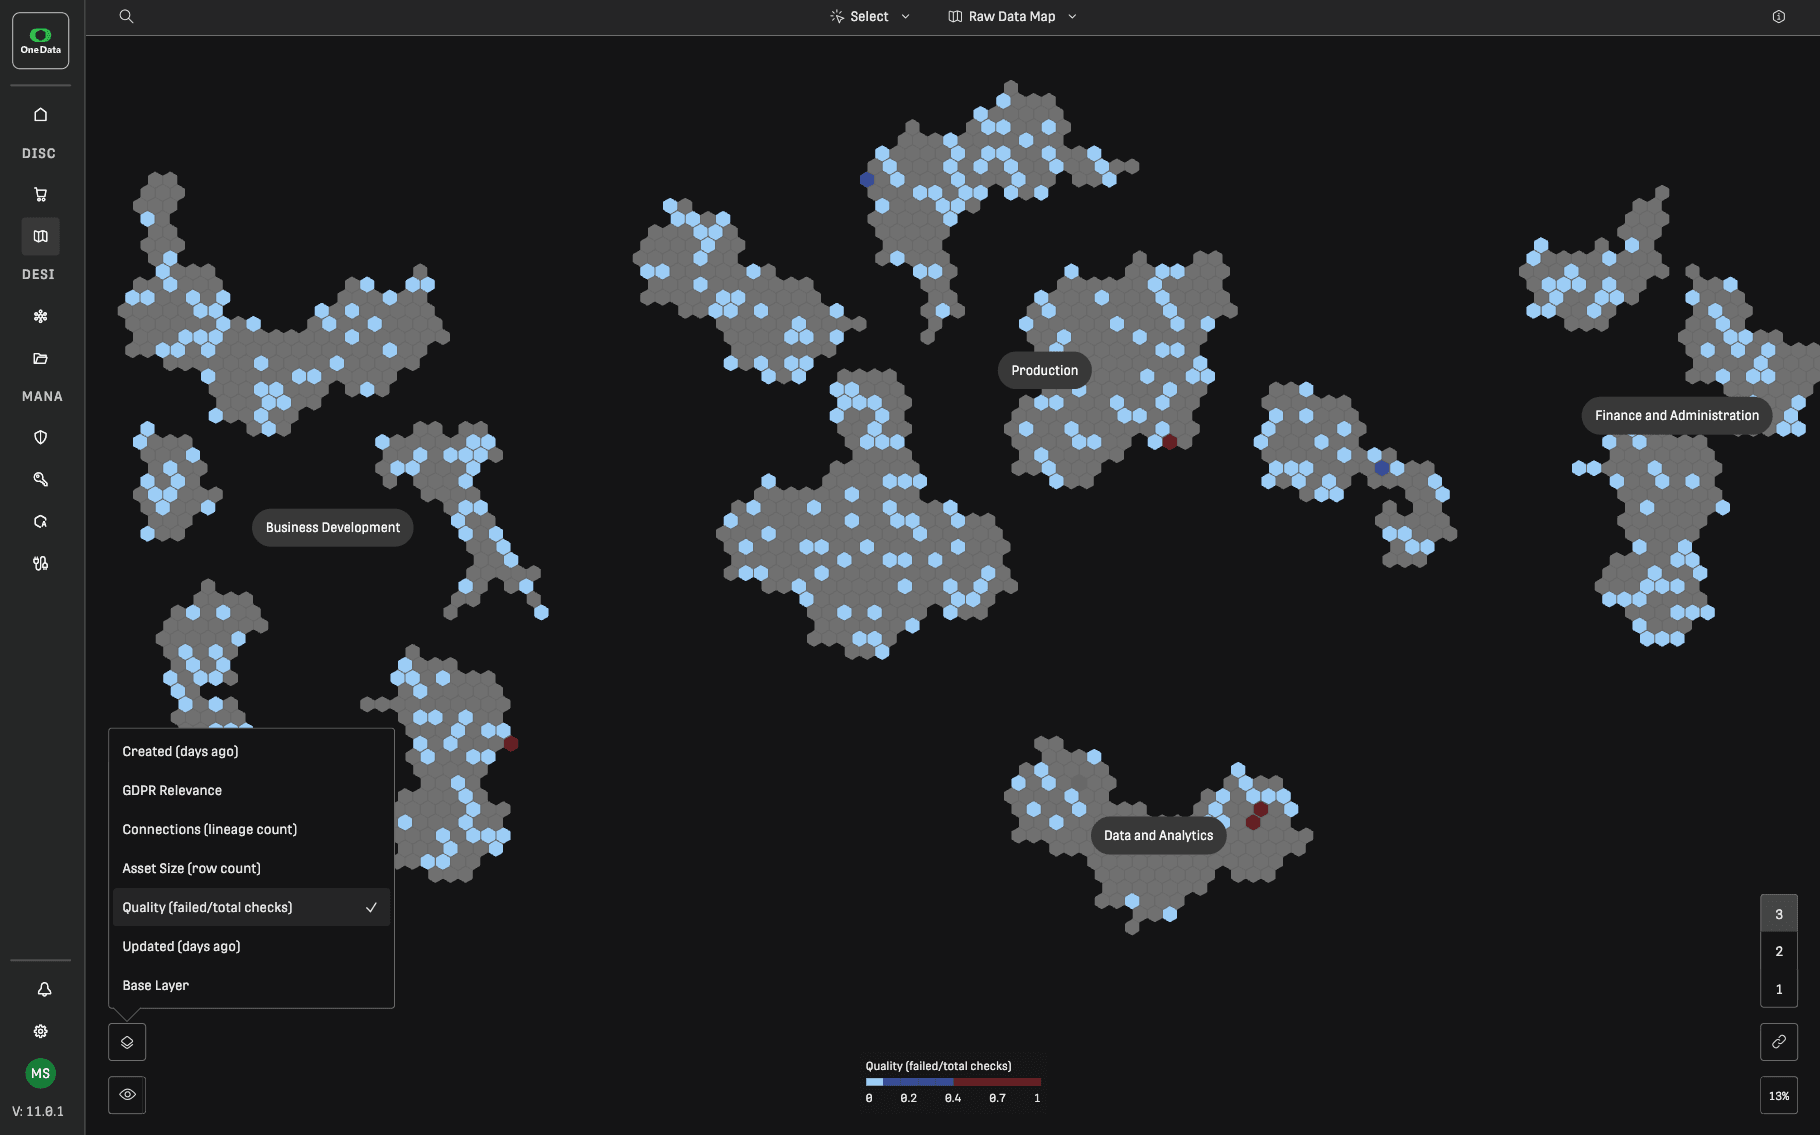
Switch layers to focus on compliance, performance, or recency. Overlay quality results, GDPR-sensitive fields, asset size, or data freshness directly on your map. Zoom into the asset level to act on insights, without leaving the context of your data landscape.
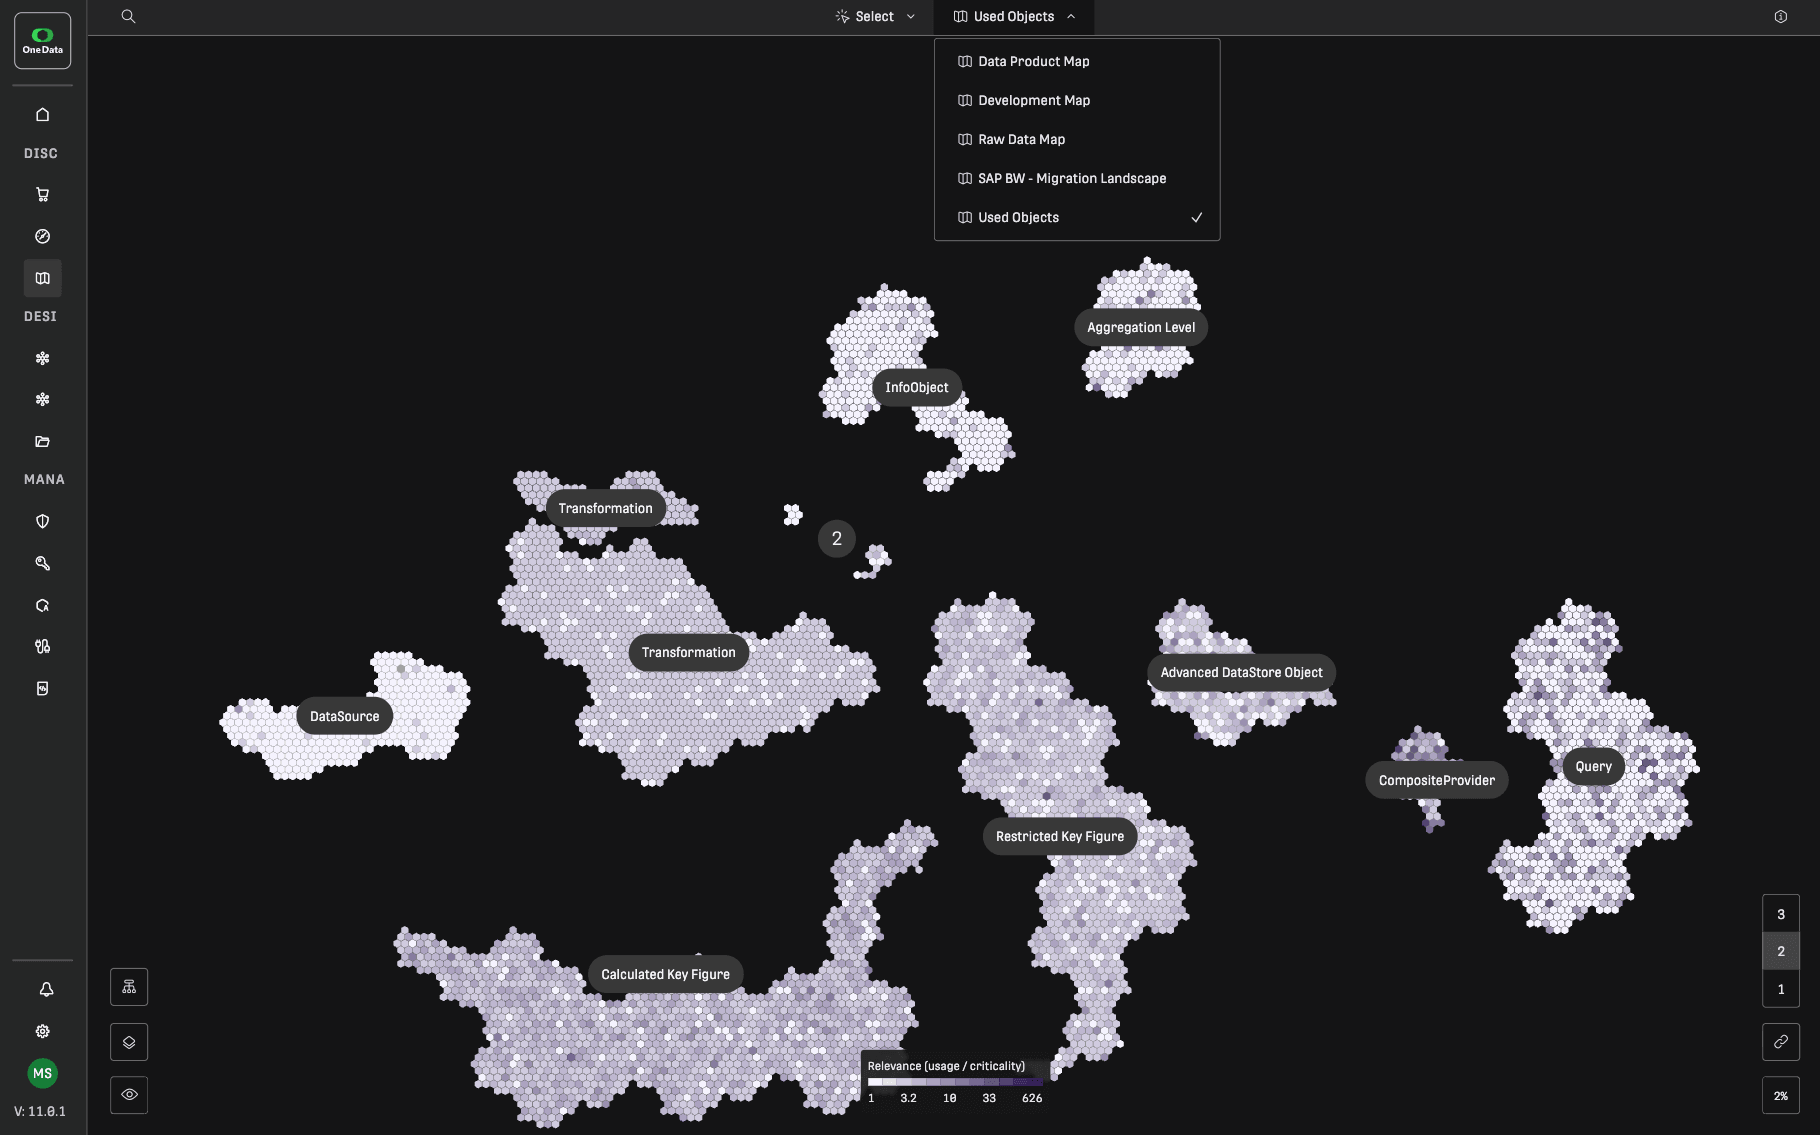
Additional maps can be added and customized on demand for specific needs. Choose purpose-built map views tailored to your role: explore raw data sources, browse certified and published data products, or track assets still in development. Every view shows the same landscape through a different lens, so business users find trusted, production-ready data without navigating through assets that are not yet ready for consumption.
Start from any asset and expand its connections step by step in a Spider Mode. Upstream to the source or downstream to every report or data product it feeds. Rather than scrolling through a static diagram, you navigate lineage interactively, following exactly the path that matters to answer your question.