

ONE DATA | EXPLORATION MAP
Gain transparency & discoverability.
Ensure end-to-end data lineage.
Layer and cluster your perspective on data.
Stop guessing what is in your data landscape. Explore it.
One Data
Exploration Map
Most organizations know they have data. Very few can tell you which assets are still in use, what depends on what, or where complexity is hiding. The Exploration Map gives you a real, interactive view of your entire data estate: every source system, SAP BW object, schema, and data product. You can query, filter, and trace it with AI. This works across SAP and non-SAP systems alike, connecting BW and ERP sources with Snowflake, Databricks, and cloud data lakes in a single, unified view. Not a static diagram. An active workspace for understanding and acting on your data.
Every asset, object, and dependency visualized and searchable across SAP and non-SAP systems. No manual inventory required.
Trace lineage, layer metadata, and query the landscape with AI before committing to a migration scope, governance action, or cleanup.
Govern SAP and non-SAP assets together, enforce quality gates, and produce trusted data products ready for AI consumption.
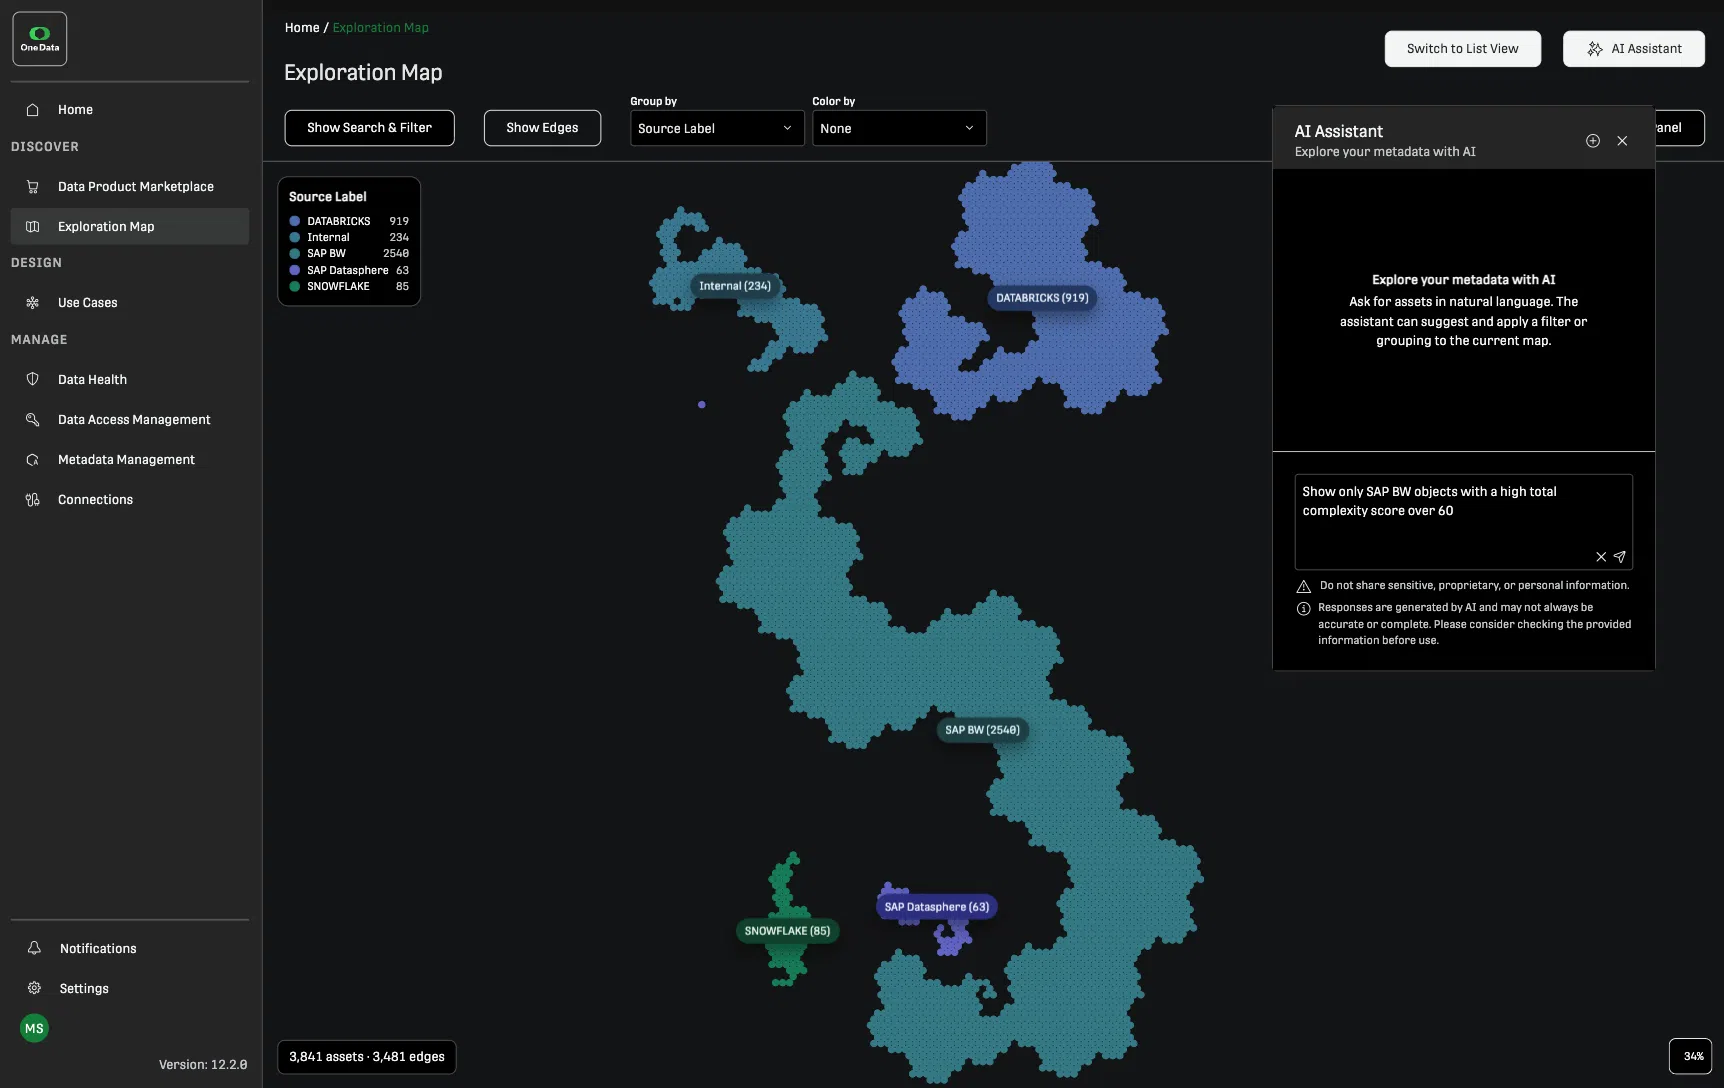
Ask a Question.
Get a Filtered Map.
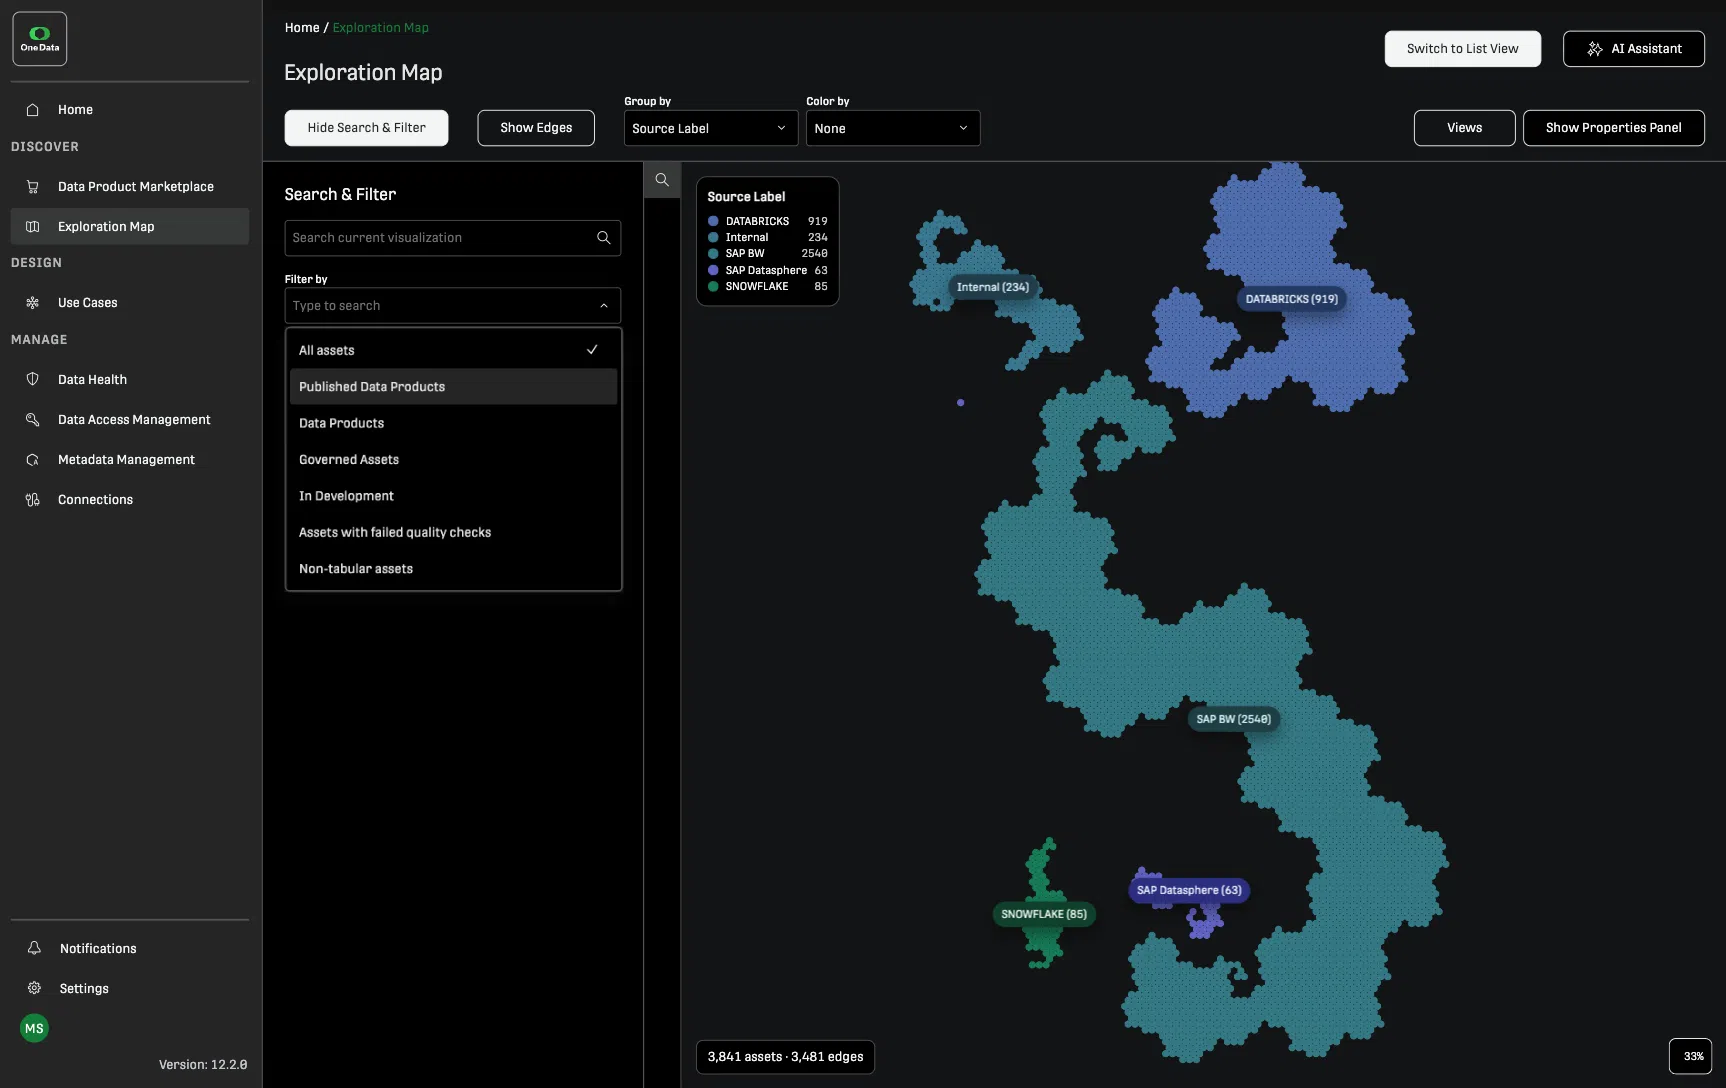
An AI assistant is built directly into the Exploration Map. It reads metadata extracted from your system and responds to plain-language questions. Ask for migration candidates with low complexity and at least 10 connected assets. The assistant returns a shortlist, explains its reasoning, and applies the matching filters to the map automatically. From there, adjust interactively: raise the downstream threshold, narrow by object type, add a complexity layer. The canvas updates in real time.
The same assistant surfaces cleanup candidates: assets with little or no usage in the past year, listed with last-seen dates. It also explains why a specific object received a high complexity score, breaking down the contributing factors rather than just showing a number.
See the Full Landscape.
Layer What Matters.
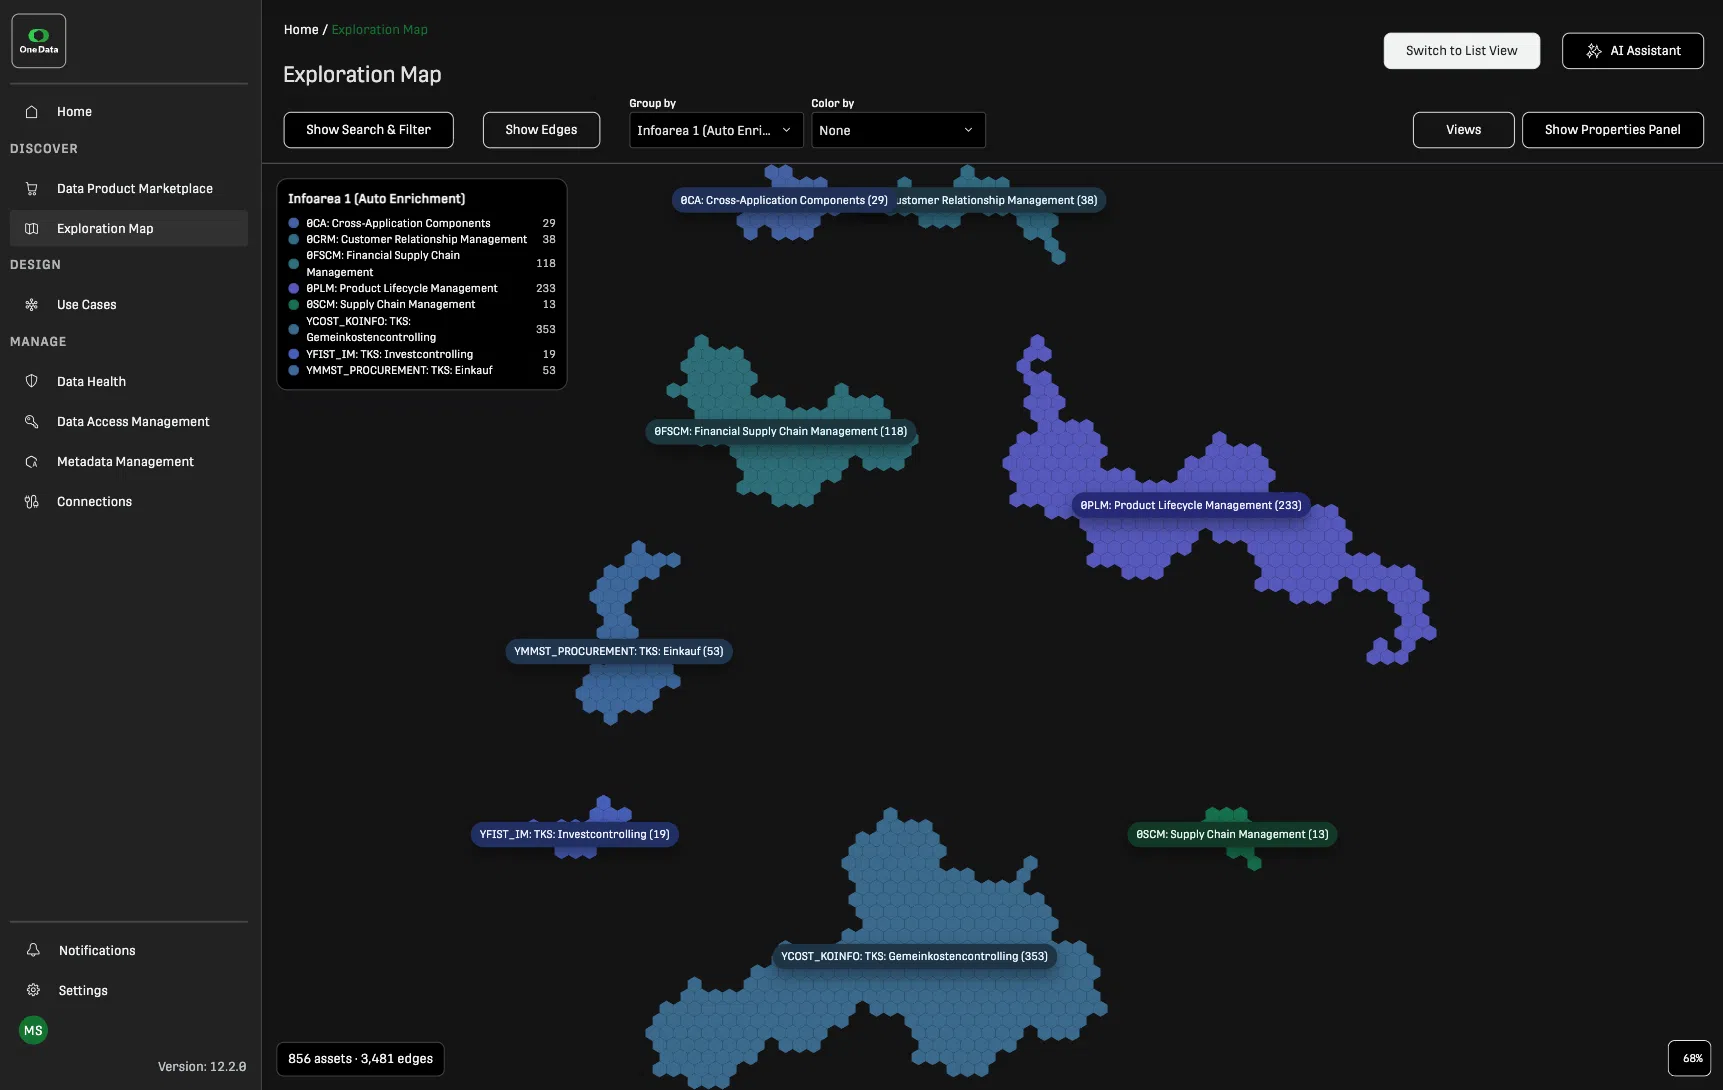
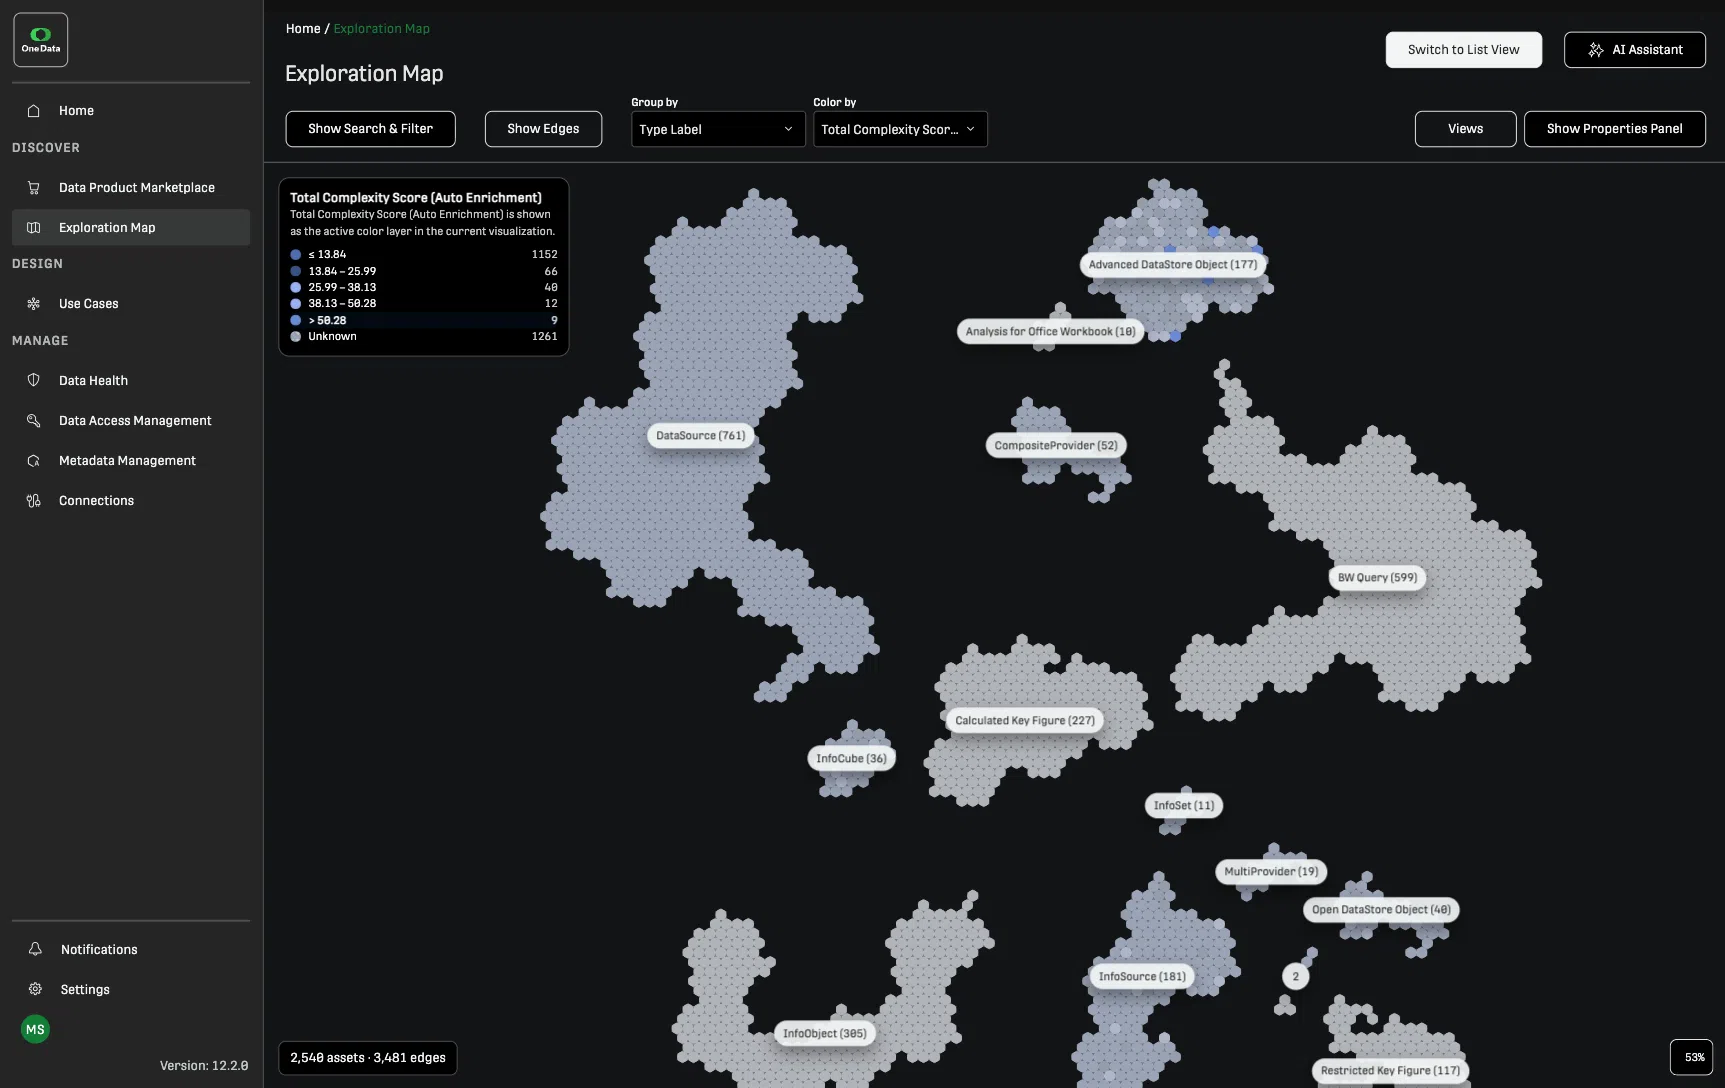
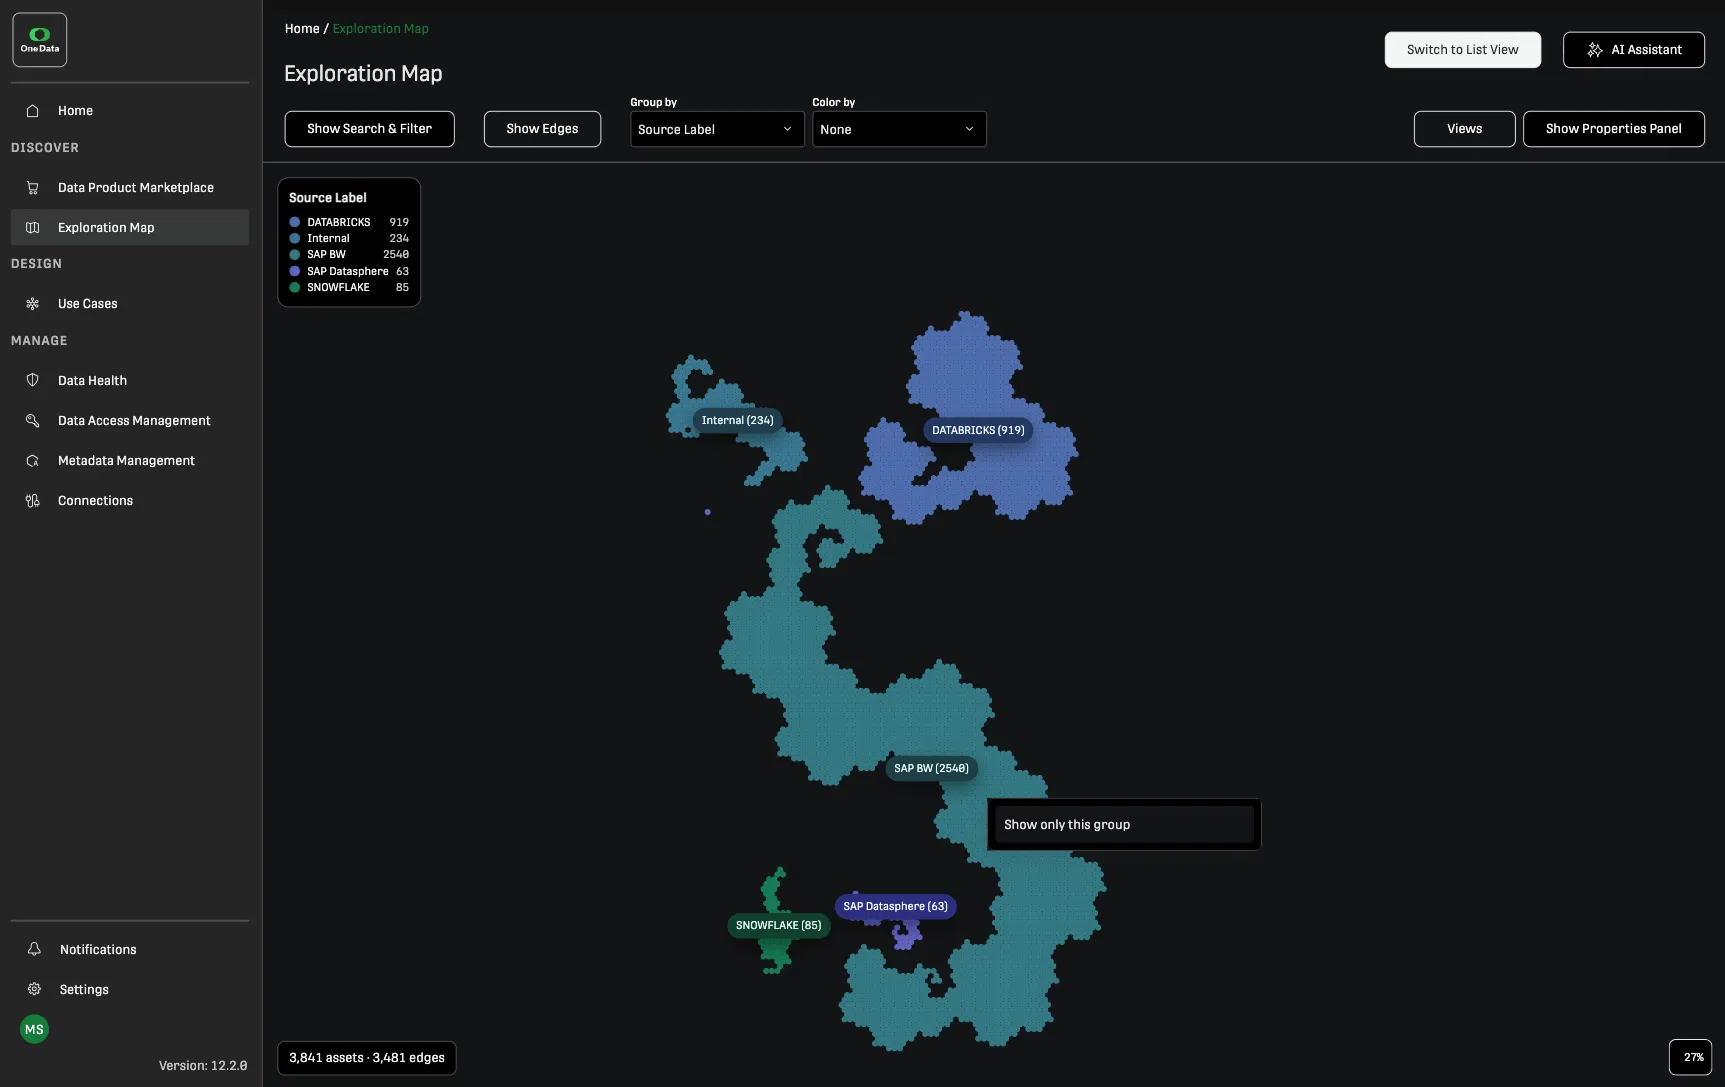
Assets are grouped into clusters that reflect your IT structure or business domains. Move between different levels like source systems, schemas, and individual objects, without losing context. Switch groupings and the canvas reorganizes instantly. Apply a metadata layer and every asset recolors by that dimension.
Impact.
See which assets depend on a given object. The map highlights high-impact objects as migration and governance priorities
Complexity.
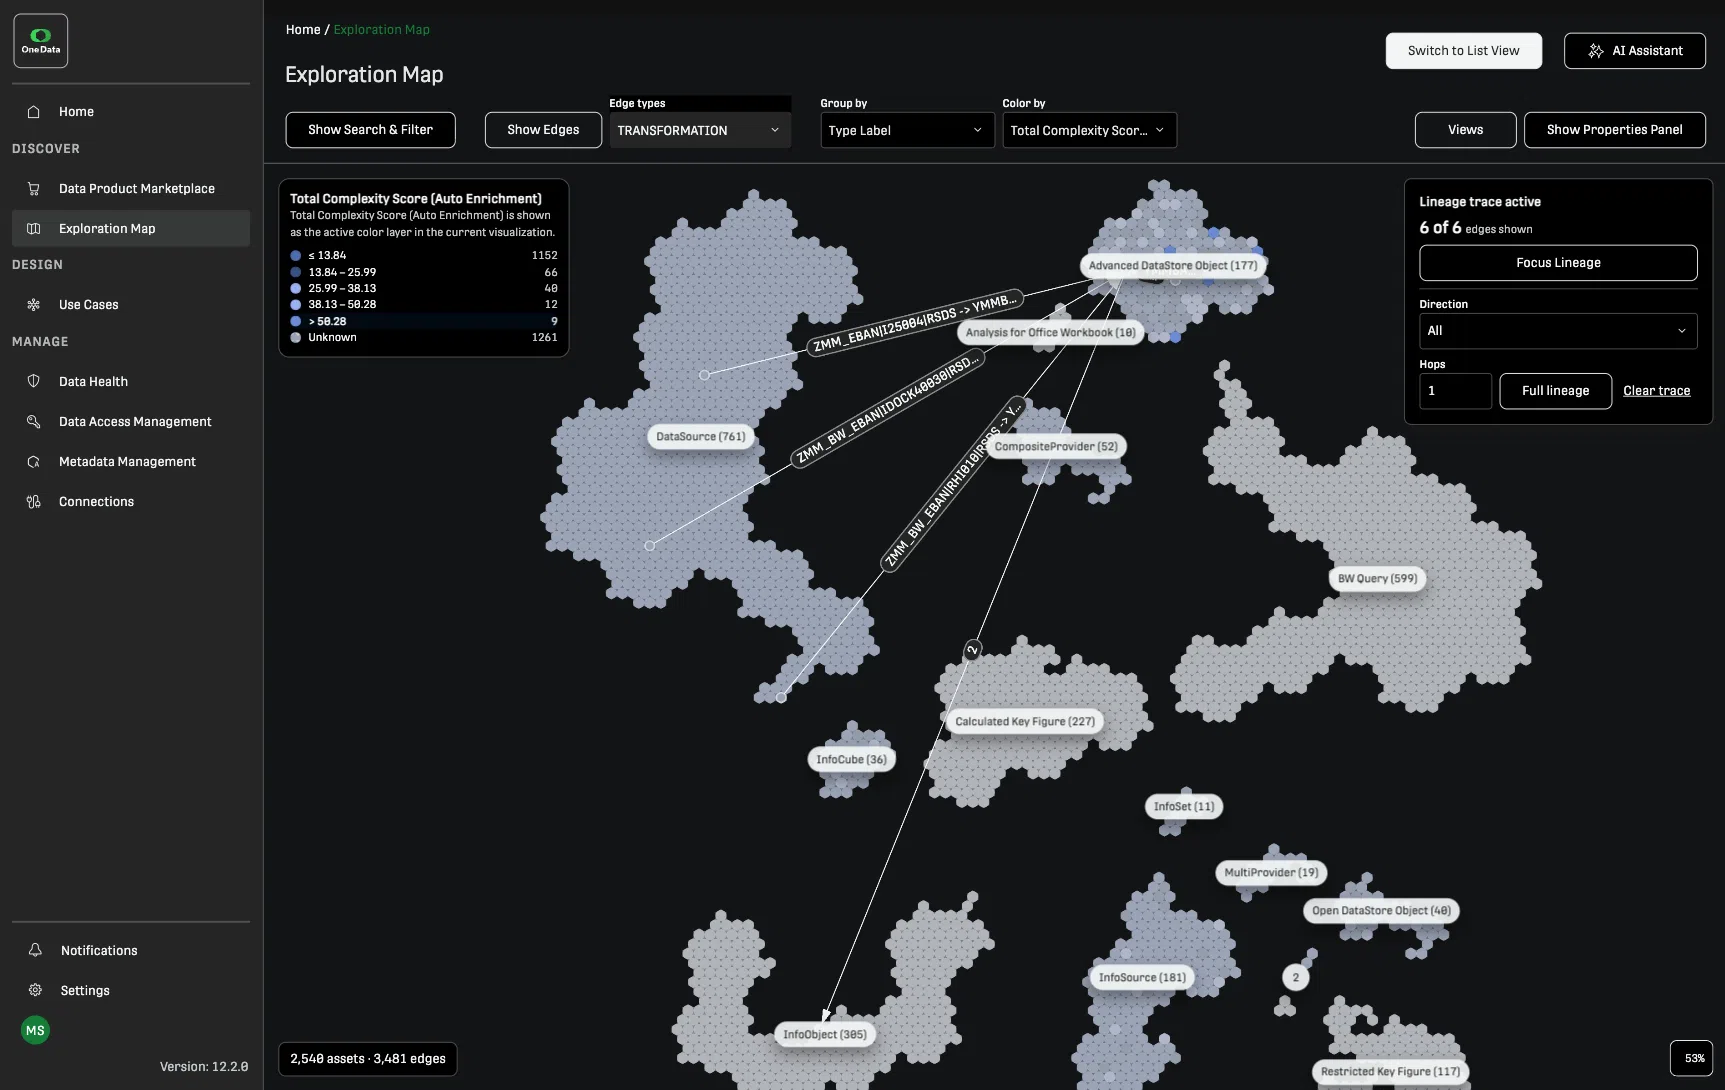
A scored, explainable breakdown per SAP BW object, covering calculated fields, ABAP lines, recursive dependencies, and transformation rules in one metric.
Freshness and Size.
When was this last updated? How large is the data asset? Surface stale, oversized, or empty assets without manual auditing.
The Missing Step
Before Every SAP BW Migration.
Know what to migrate and what to retire.
Usage data, lineage, and impact scores show which BW objects are actively delivering value and which have not been used in years. Scope your migration based on evidence, not assumptions, and reduce cloud cost from day one. The result is a right-sized migration scope, documented business logic, and up to 70% faster data discovery before a single line of transformation code is written.
SAP BW migrations that skip a transparency step tend to inflate scope, carry forward unused objects, and surface undocumented dependencies too late. The Exploration Map provides the shared, evidence-based view of the existing BW landscape that migration teams need before making decisions.
One View Across SAP and Non-SAP.
AI-Ready from Day One.
Most enterprises run SAP BW alongside Snowflake, Databricks, or other cloud platforms. Treating these as separate landscapes creates blind spots in lineage, duplicates governance effort, and slows down AI initiatives. One Data brings SAP and non-SAP assets together in a single model, making them governed and traceable through a shared Exploration Map.
Column-level lineage across every system
One Data delivers automated column-level lineage from original BW and ERP source tables through to the consuming application, whether that application runs in Datasphere, Snowflake, Databricks, or a cloud data lake.
Pull the thread on any number
Start from any asset and expand connections upstream or downstream, one step at a time or all at once. Follow a BW query back to its data sources or trace a calculated key figure forward to every report and data product that depends on it. Focus Lineage isolates a single path for deep inspection.
Save views and share shortlists
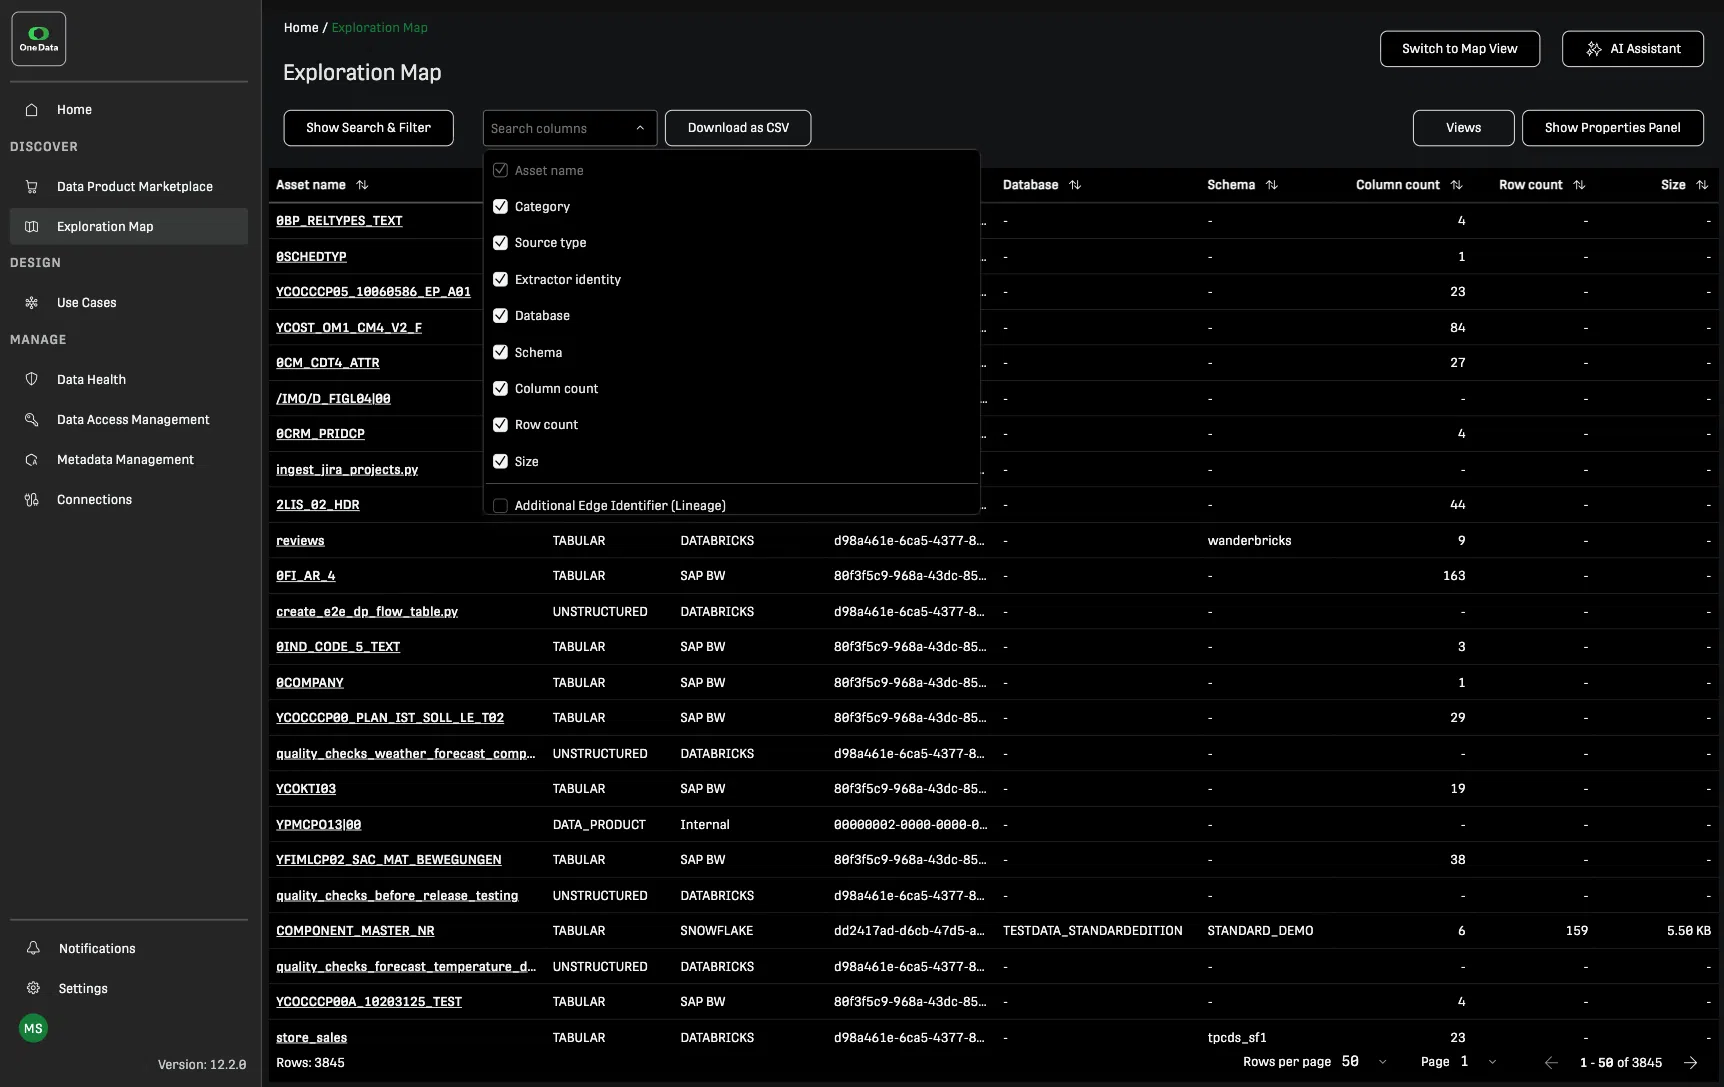
Any combination of filters, groupings, color layers, and column selections can be saved as a named view and shared with colleagues. Export the current asset list to Excel or CSV for stakeholder workshops and offline review.
Frequently Asked
Questions
The Exploration Map is One Data’s interactive workspace for understanding your data landscape based on your metadata. It visualizes every connected source system, schema, SAP BW object, and data product as a navigable map, with AI-assisted querying, metadata layers, lineage tracing, and configurable list and export views built in. It covers both SAP and non-SAP systems in a single view.
A catalog documents what exists. The Exploration Map lets you actively query, filter, trace, and analyze the landscape using AI, and act on what you find without leaving the tool. It updates continuously from live metadata extraction, so what you see reflects the current state of your systems, not last quarter’s documentation.
Lineage is computed from extracted metadata and relationships defined in data contracts and data products. One Data traces dependencies across system boundaries, connecting a raw ERP source table through BW transformations to a published data product consumed in Snowflake or Databricks. Column-level lineage is automated across the full chain.
Yes. The map is useful for any team that needs to understand, govern, or make decisions about a data landscape. Migration planning is one use case. Others include identifying assets ready for AI use cases, auditing Process Mining-relevant fields, scoping cleanup initiatives, and establishing ongoing governance across hybrid estates.
Yes. Any filtered, configured view of the asset landscape can be exported to Excel or CSV. Saved views including their filters, groupings, and column configurations can be shared with colleagues so teams work from a consistent, synchronized starting point.